

If your reporting feels like it's always sluggish, your team's confidence in the numbers probably is too. It can feel like the question, "how are we actually doing this month versus the last period?", goes unanswered, and the answer requires tinkering and time you don't have to waste.
That's the position Shibani Finance, a foreign exchange dealer based in Mauritius, was in when they came to us. They'd operated on the island for decades, with branches running across the island, hundreds of transactions flowing through the network daily, and all of it sitting safely inside an on-premises database nobody could consistently report from without hours of manual work. They knew exactly what was slowing them down, which made assessing the root of the problem quick and painless.
In this case study, we'll walk you through how we connected their database through a secure Power BI gateway, modeled it into a proper star schema, and gave both executives and power users live, governed access to the same data, instead of everyone working from their own slightly different interpretation.
The client: Shibani Finance
The group, headquartered in Mauritius, has operated as a foreign exchange dealer on the island since 1997. Over that time, the business diversified the services it offered its customers, from foreign currency exchange into a fuller suite of financial products, including Forex transactions and Western Union money transfers. Each addition brought its own stream of transaction data that needed to be captured, reconciled, and reported on.
The resilience of a business like Shibani Finance, one that's weathered two decades of currency swings and regional economic shifts, suggests a level of operational discipline most companies would envy. But that same longevity meant the systems behind the scenes had been quietly accumulating age, built up in layers over years rather than designed once, properly, from the start.
The challenge: data that required manual treatment for reports
All of the group's operational activity (transactions, customer history, who handled what and at which branch) lived safely inside an on-premises database, on the client's own infrastructure. Although it was safely registered and maintained, it was frankly difficult for the team to poke around and pull from when they needed to create reports.
Daily reporting had become a time crunch where someone had to manually source the data needed, reshape it for reports, and repeat the same frustrating pattern. Across a multi-branch operation processing that kind of volume, step by step, it adds up fast, and leadership found decision-making was impacted. This kind of manual reporting bottleneck is a major barrier to swift decision-making.
Until recently, this was simply how Shibani Finance operated, and it worked well enough. But the growing use of AI-assisted and automated reporting tools across the financial services sector has led to something of a general rise in expectations, accompanied by a real desire to modernise, faster.
Recent research indicates that Mauritius itself has been moving quickly on this front at a national level. In March 2026, Mauritius became the first country in Africa, and the 32nd worldwide, to adhere to the IMF's Special Data Dissemination Standard Plus, the highest tier of the IMF's data transparency framework, committing the country to publishing more rigorous, timely macroeconomic and financial statistics than almost anywhere else on the continent. That same momentum is showing up at the industry level too: in June 2026, the government launched its National Fintech Strategy, aiming to position the country as Africa's trusted fintech hub, with digital infrastructure as one of its six core pillars. All of these inflection points coincide with a broader shift on the ground, where basic reporting infrastructure remains a genuinely large unlock for individual businesses at this stage of data maturity.
The challenge: growing transaction volume needed better infrastructure
The project for this client came after a period of juggling in the form of growing transaction volume, a diverse product range, and a leadership team that needed fresher data insights to manage it all.
The architecture, at a glance
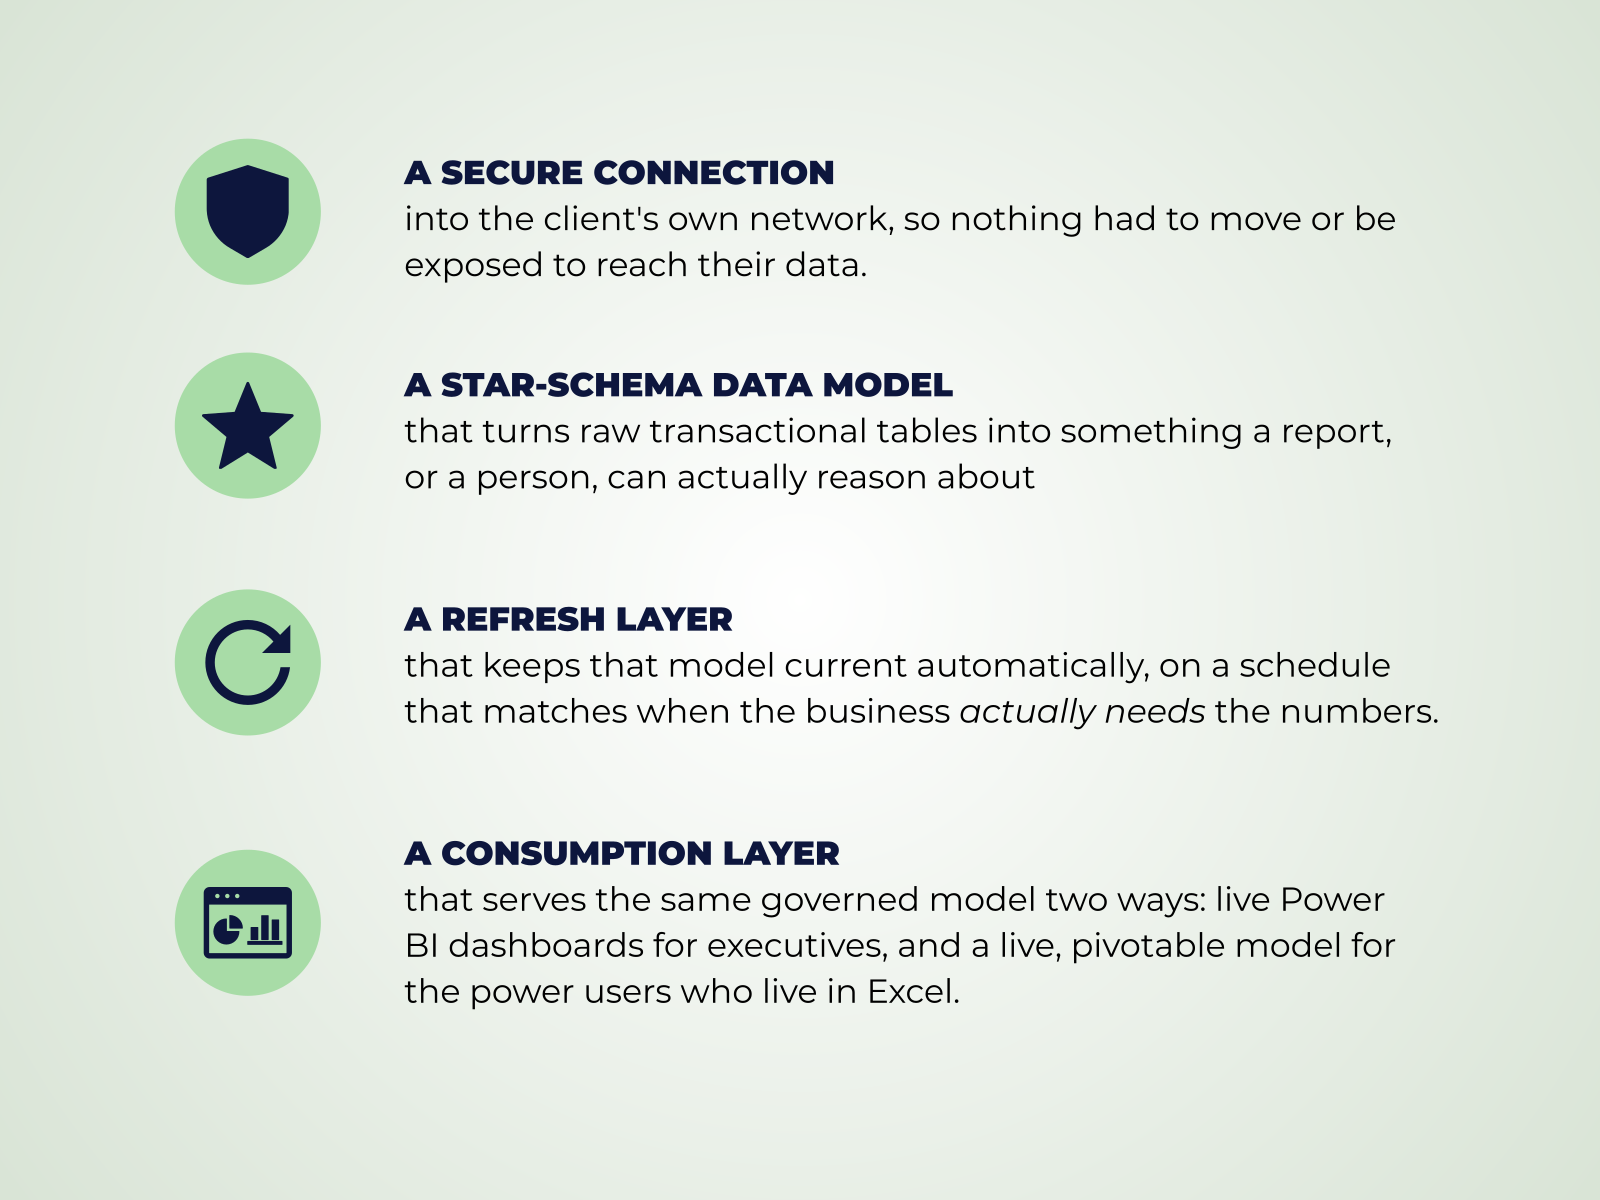
Before we elaborate on what each layer brings to the business, here's an overview of what we built for Shibani Finance:
Layer 1: connecting securely
For all financial services clients like Shibani Finance, the starting requirement is always that the source data cannot move.
That's exactly what Power BI's on-premises data gateway, running in standard mode, is built for. We installed it inside the client's own network, sitting between their SQL Server database and Power BI in the cloud. The gateway only ever makes outbound calls to the Power BI service over standard HTTPS.
A few other details mattered just as much: high availability, with the gateway set up as a small cluster rather than a single machine, so a routine reboot or patch doesn't take down the next morning's numbers. Least-privilege access, using a dedicated, read-only service account scoped to the specific views the reports need. And credentials that never travel in the clear, encrypted with an asymmetric key pair before anything leaves the client's premises.
Layer 2: modeling the data for finance services
Raw operational tables were then built to process a transaction quickly and safely. The genuinely satisfying part of this project was shaping years of raw operational data into one clean, curated Power BI dataset, featuring a classic star schema, with a central transactions fact table surrounded by date, branch, customer, team, and currency dimensions.
Two modeling decisions took care of most of the work:
- Every dimension uses its own surrogate key, rather than reusing the source system's internal IDs. This keeps the model fast, and insulates it from changes on the operational side.
- Change over time is handled properly, using a Type 2 slowly changing dimension. If a teller transfers branches, historical transactions still report against the branch and team they actually happened under, not wherever that person sits today.
Layer 3: scheduled and incremental refreshes
For the third layer we set up scheduled refresh in the Power BI service, timed to when the business actually needs fresh numbers, pulling the latest transactions before the workday starts.
With years of transaction history behind the model, the fact table refreshes incrementally rather than from scratch every time, keeping refresh times short even as the history behind the model keeps growing. We also set up refresh monitoring for added peace of mind. If a refresh doesn't complete, the team knows immediately.
Layer 4: Power BI as a live cube in Excel
A published Power BI dataset isn't only a set of dashboard pages. Underneath, it's a live, queryable analytical engine, and dashboards are only one way to query it. Using Power BI's "Analyze in Excel" feature, power users can also open a PivotTable wired directly to the governed dataset: no export, no static file, querying the exact same current, refreshed data that's on the executive dashboard.
| Approach | Best fit | Skip it if |
|---|---|---|
| Power BI | Your business is already inside the Microsoft ecosystem and your teams use Excel. | You're not using Excel or other Microsoft tools day to day, and would rather build something different. |
| Tableau | Your team needs custom visual design and already has a dedicated BI specialist to maintain it. | You want business users editing and extending the model themselves without an expert. |
| Looker Studio | Your business already uses Google's ecosystem and has lighter reporting needs. | Your data is relational and needs the kind of governed modelling a star schema provides, not just charts on top of a spreadsheet. |
| A fully custom-built reporting system | Businesses with very specific, unusual reporting needs no off-the-shelf tool covers well. | You want to avoid being tied to a developer for every future change, and have a small in-house team. |
Power BI vs. the alternatives.
When this isn't the best approach
This kind of build is suited to businesses that already have a real database sitting behind them, even an on-premises one, not just spreadsheets with no underlying structure at all. If your data genuinely is made up of scattered files, the first step isn't a Power BI gateway. It's better to get that data into a proper database to begin with. It's also not the right starting point for a business too small to have more than one or two people looking at reports regularly.
What changed for the team
Now stakeholders have one place to check, trust, and plan from, instead of chasing whoever pulled the numbers last. The biggest change is harder to measure than it is to feel: the team finally has one source of truth everyone actually believes, and that's what changes everything else downstream. Reporting stops being something someone quietly corrects after the fact, and starts being something people can build a decision on the moment they see it.
This kind of foundation matters for more than just reporting, too. What we set up here, technically speaking, is a semantic layer: a governed, well-defined model of what a transaction, a branch, and a customer actually mean. That's the same foundation AI enablement work builds on. You can't ask a system to answer questions about your data in plain language if the data underneath it isn't already speaking one consistent language itself.
Working with Portage Labs
Interested in getting more out of the data your business already has? Portage Labs builds the reporting and data infrastructure growing companies need, from secure Power BI implementations and data analytics work through to the AI enablement that a properly governed data foundation makes possible down the line. The aim is always the same: to deliver a system your team will trust and actually use.
We'd love to chat about what your data could be telling you.
Frequently asked questions
Do I need to migrate my data to use Power BI?
No. Power BI's on-premises data gateway connects to data wherever it currently lives, on your own servers, without requiring you to move or expose it.
What is a data gateway, and is it secure?
A data gateway is a small piece of software that sits between your own network and Power BI in the cloud, making only outbound calls so nothing is ever listening for inbound traffic. Combined with a read-only service account and encrypted credentials, it lets Power BI reach your data without your security team opening anything up.
Can our team keep using Excel once this is in place?
Yes. A properly modeled Power BI dataset can be queried directly from Excel using the "Analyze in Excel" feature. It handily gives power users a live PivotTable connected to the same governed data as the executive dashboard.
Interested in reading about our custom ERP Airtable builds? Check it out here.

